| Home | Trees | Indices | Help |
|
|---|
|
|

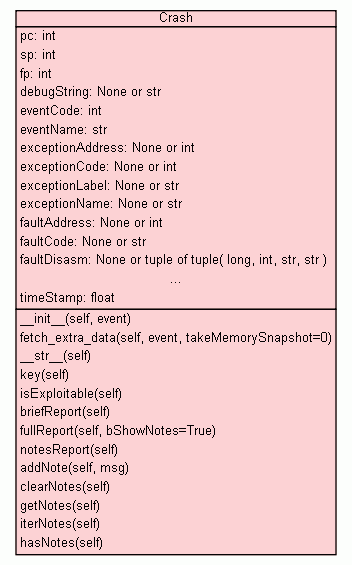
Represents a crash, bug, or another interesting event in the debugee.
|
|||
|
|||
|
|||
|
|||
| tuple( str, str ) |
|
||
|
|||
|
|||
|
Inherited from |
|||
| Key | |||
|---|---|---|---|
| (opaque) |
|
||
| Report | |||
| str |
|
||
| str |
|
||
| str |
|
||
| Notes | |||
|
|||
|
|||
| list( str ) |
|
||
| listiterator |
|
||
| bool |
|
||
|
|||
| None or str |
debugString Debug string sent by the debugee. |
||
| int |
eventCode Event code as defined by the Win32 API. |
||
| str |
eventName Event code user-friendly name. |
||
| None or int |
exceptionAddress Memory address where the exception occured. |
||
| None or int |
exceptionCode Exception code as defined by the Win32 API. |
||
| None or str |
exceptionLabel Label pointing to the exception address. |
||
| None or str |
exceptionName Exception code user-friendly name. |
||
| None or int |
faultAddress Access violation memory address. |
||
| None or str |
faultCode Data pointed to by the program counter. |
||
| None or tuple of tuple( long, int, str, str ) |
faultDisasm Dissassembly around the program counter. |
||
| None or str |
faultLabel Label pointing to the access violation memory address. |
||
| None or str |
faultMem Data pointed to by the exception address. |
||
| None or dict( int→ str ) |
faultPeek Dictionary mapping guessed pointers at faultMem to the data they point to. |
||
| None or int |
faultType Access violation type. |
||
| None or bool |
firstChanceTrue for first chance exceptions, False for
second chance.
|
||
| bool |
isOurBreakpointTrue for breakpoints defined by the Debug class,
False otherwise.
|
||
| bool |
isSystemBreakpointTrue for known system-defined breakpoints,
False otherwise.
|
||
| None or str |
labelPC Label pointing to the program counter. |
||
| None or int |
lpBaseOfDll Base of module where the program counter points to. |
||
| None or list of win32.MemoryBasicInformation objects. |
memoryMap Memory snapshot of the program. |
||
| None or str |
modFileName File name of module where the program counter points to. |
||
| list( str ) |
notes List of strings, each string is a note. |
||
| int |
pid Process global ID. |
||
| dict( str → int ) |
registers Dictionary mapping register names to their values. |
||
| None or dict( str → str ) |
registersPeek Dictionary mapping register names to the data they point to. |
||
| None or str |
stackFrame Data pointed to by the stack pointer. |
||
| None or dict( int → str ) |
stackPeek Dictionary mapping stack offsets to the data they point to. |
||
| tuple( int, int ) |
stackRange Stack beginning and end pointers, in memory addresses order. |
||
| None or tuple of tuple( int, int, str ) |
stackTrace Stack trace of the current thread as a tuple of ( frame pointer, return address, module filename ). |
||
| None or tuple( str... ) |
stackTraceLabels Tuple of labels pointing to the return addresses in the stack trace. |
||
| None or tuple( int... ) |
stackTracePC Tuple of return addresses in the stack trace. |
||
| None or tuple of tuple( int, str ) |
stackTracePretty Stack trace of the current thread as a tuple of ( frame pointer, return location ). |
||
| int |
tid Thread global ID. |
||
| float |
timeStamp Timestamp as returned by time.time(). |
||
|
|||
| int |
pc Value of the program counter register. |
||
| int |
sp Value of the stack pointer register. |
||
| int |
fp Value of the frame pointer register. |
||
|
Inherited from |
|||
|
|||
x.__init__(...) initializes x; see x.__class__.__doc__ for signature
|
Fetch extra data from the Event object.
Note: This is only needed for exceptions. Since this method may take a little longer to run, it's best to call it only after you've determined the crash is interesting and you want to save it. |
str(x)
|
Generates an approximately unique key for the Crash object. This key can be used as an heuristic to determine if two crashes were caused by the same software error. Ideally it should be treated as an opaque object.
|
Guess how likely is it that the bug causing the crash can be leveraged into an exploitable vulnerability.
Note: Don't take this as an equivalent of a real exploitability analysis, that can only be done by a human being! This is only a guideline, useful for example to sort crashes - placing the most interesting ones at the top. See Also: The heuristics are similar to those of the !exploitable extension for WinDBG, which can be downloaded from here: |
|
|
|
Add a note to the crash event.
|
Get the list of notes of this crash event.
|
Iterate the notes of this crash event.
|
|
|
|||
debugStringDebug string sent by the debugee.
|
exceptionAddressMemory address where the exception occured.
|
exceptionCodeException code as defined by the Win32 API.
|
exceptionLabelLabel pointing to the exception address.
|
exceptionNameException code user-friendly name.
|
faultAddressAccess violation memory address. Only applicable to memory faults.
|
faultCodeData pointed to by the program counter.
|
faultDisasmDissassembly around the program counter.
|
faultLabelLabel pointing to the access violation memory address. Only applicable to memory faults.
|
faultMemData pointed to by the exception address.
|
faultPeekDictionary mapping guessed pointers at faultMem to the data they point to.
|
faultTypeAccess violation type. Only applicable to memory faults. Should be one of the following constants:
|
firstChanceTrue for first chance exceptions, False for
second chance.
|
isOurBreakpointTrue for breakpoints defined by the Debug class,
False otherwise.
|
isSystemBreakpointTrue for known system-defined breakpoints,
False otherwise.
|
labelPCLabel pointing to the program counter.
|
lpBaseOfDllBase of module where the program counter points to.
|
memoryMapMemory snapshot of the program. May contain the actual data from the entire process memory if requested. See fetch_extra_data for more details.
|
modFileNameFile name of module where the program counter points to.
|
registersPeekDictionary mapping register names to the data they point to.
|
stackFrameData pointed to by the stack pointer.
|
stackPeekDictionary mapping stack offsets to the data they point to.
|
stackRangeStack beginning and end pointers, in memory addresses order.
|
stackTraceStack trace of the current thread as a tuple of ( frame pointer, return address, module filename ).
|
stackTraceLabelsTuple of labels pointing to the return addresses in the stack trace.
|
stackTracePCTuple of return addresses in the stack trace.
|
stackTracePrettyStack trace of the current thread as a tuple of ( frame pointer, return location ).
|
|
|||
pcValue of the program counter register.
|
spValue of the stack pointer register.
|
fpValue of the frame pointer register.
|
| Home | Trees | Indices | Help |
|
|---|
| Generated by Epydoc 3.0.1 on Fri Feb 12 19:46:16 2010 | http://epydoc.sourceforge.net |